Enterprise AI Case Study
Enterprise Data Analysis
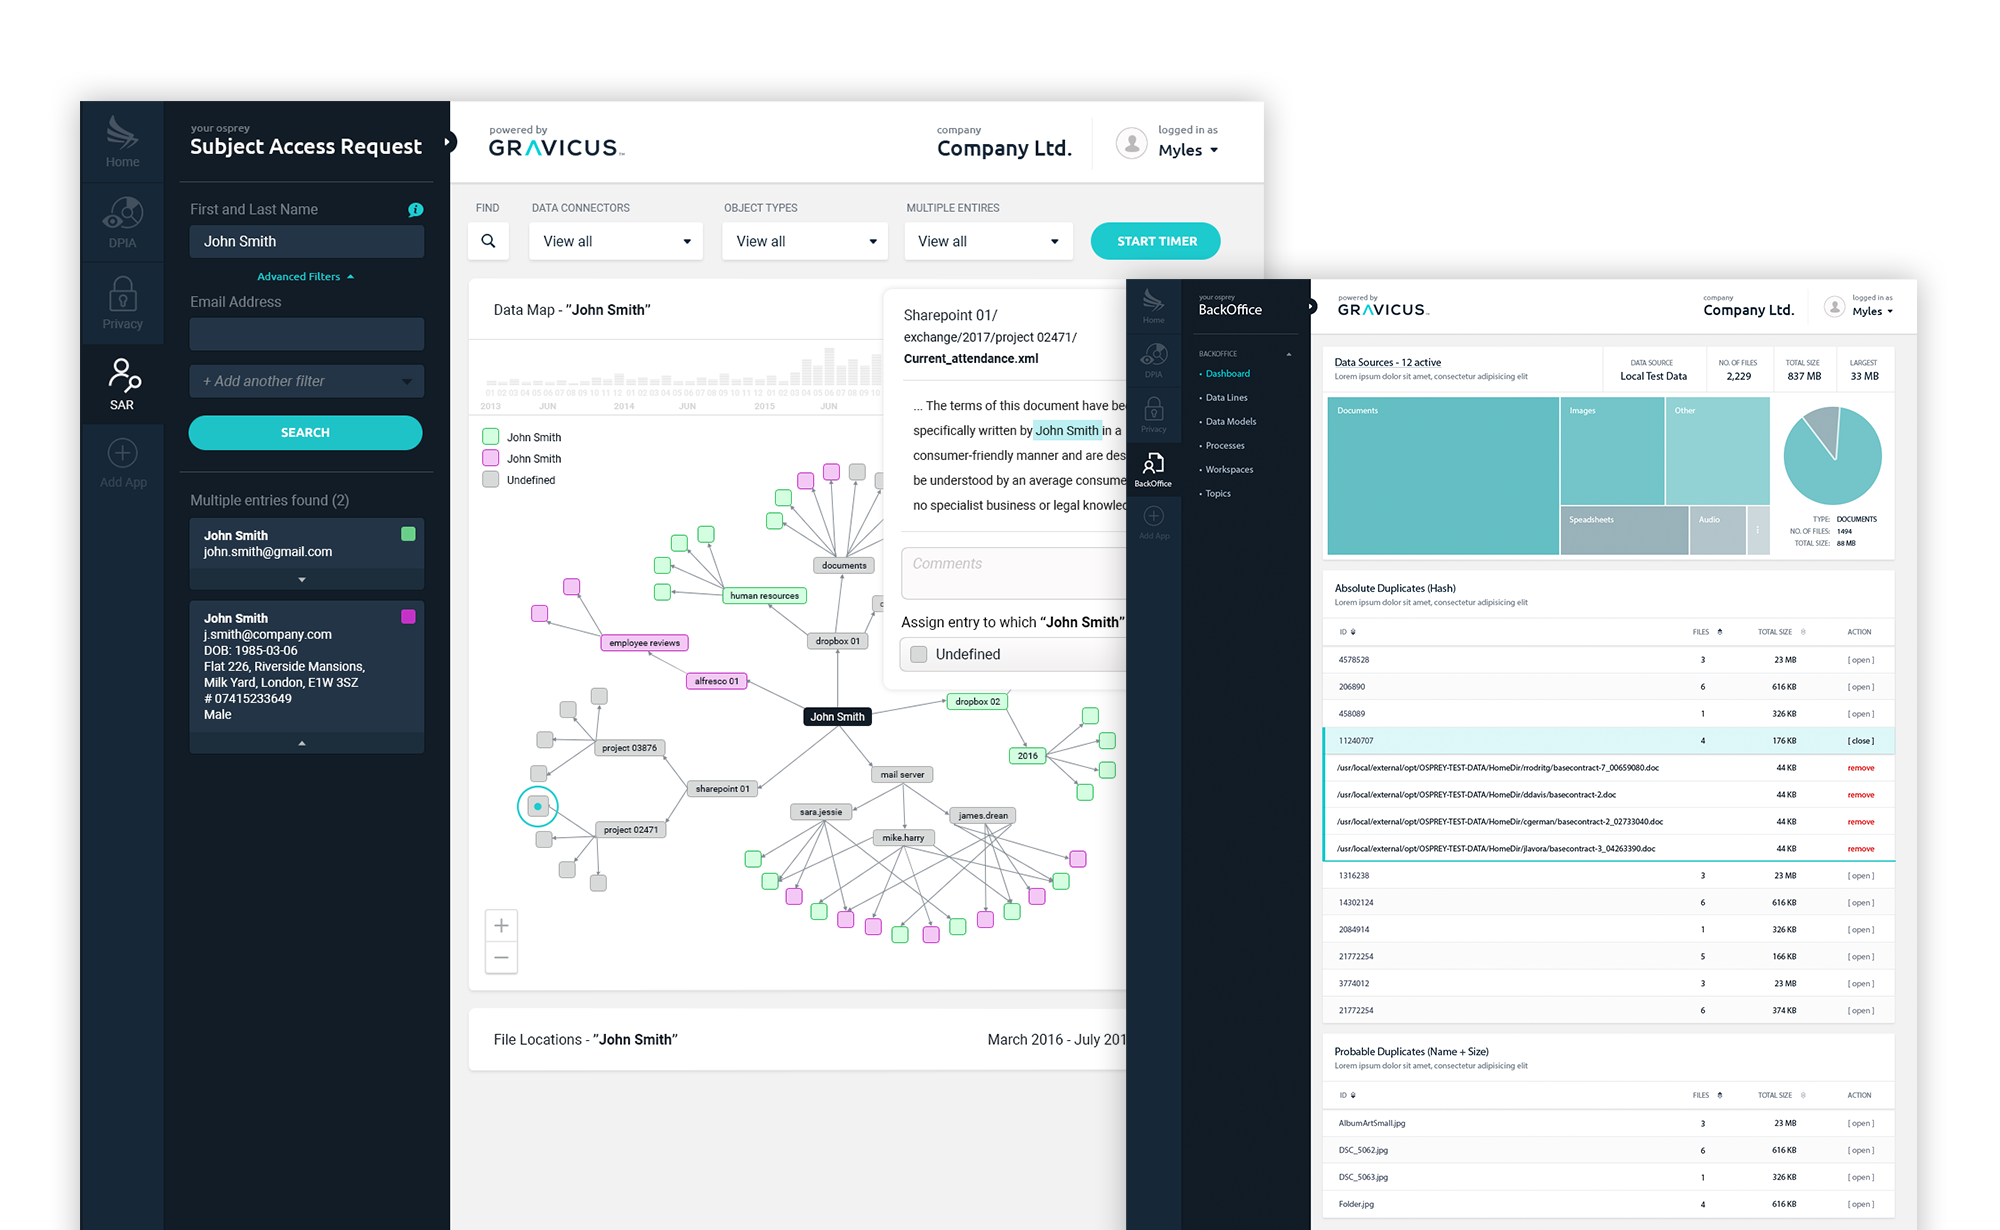
Gravicus provides businesses with dynamic data management tools using a multitude of AI capabilities (e.g. machine learning and natural language processing) to search, analyse and organise data rapidly for protection, compliance and insights.
Location
On-site, Remote
Services
Data Visualization, UX/UI Design, ReactJS
Role
Head of Design (1 year, 7 months)
Background
The Story
Gravicus began building tools for GDPR compliance and later pivoted into an enterprise data analysis company. As Head of Design, I worked within the product lifecycle from research to initial wireframing, prototyping (UX), into high-fidelity (UI) design and assisted in the handover to development. Working alongside a fantastic team, together we built and managed not just the multiple product apps but also the customer-facing website, social marketing and a variety of other ongoing print and marketing materials.
UX Design
User Experience
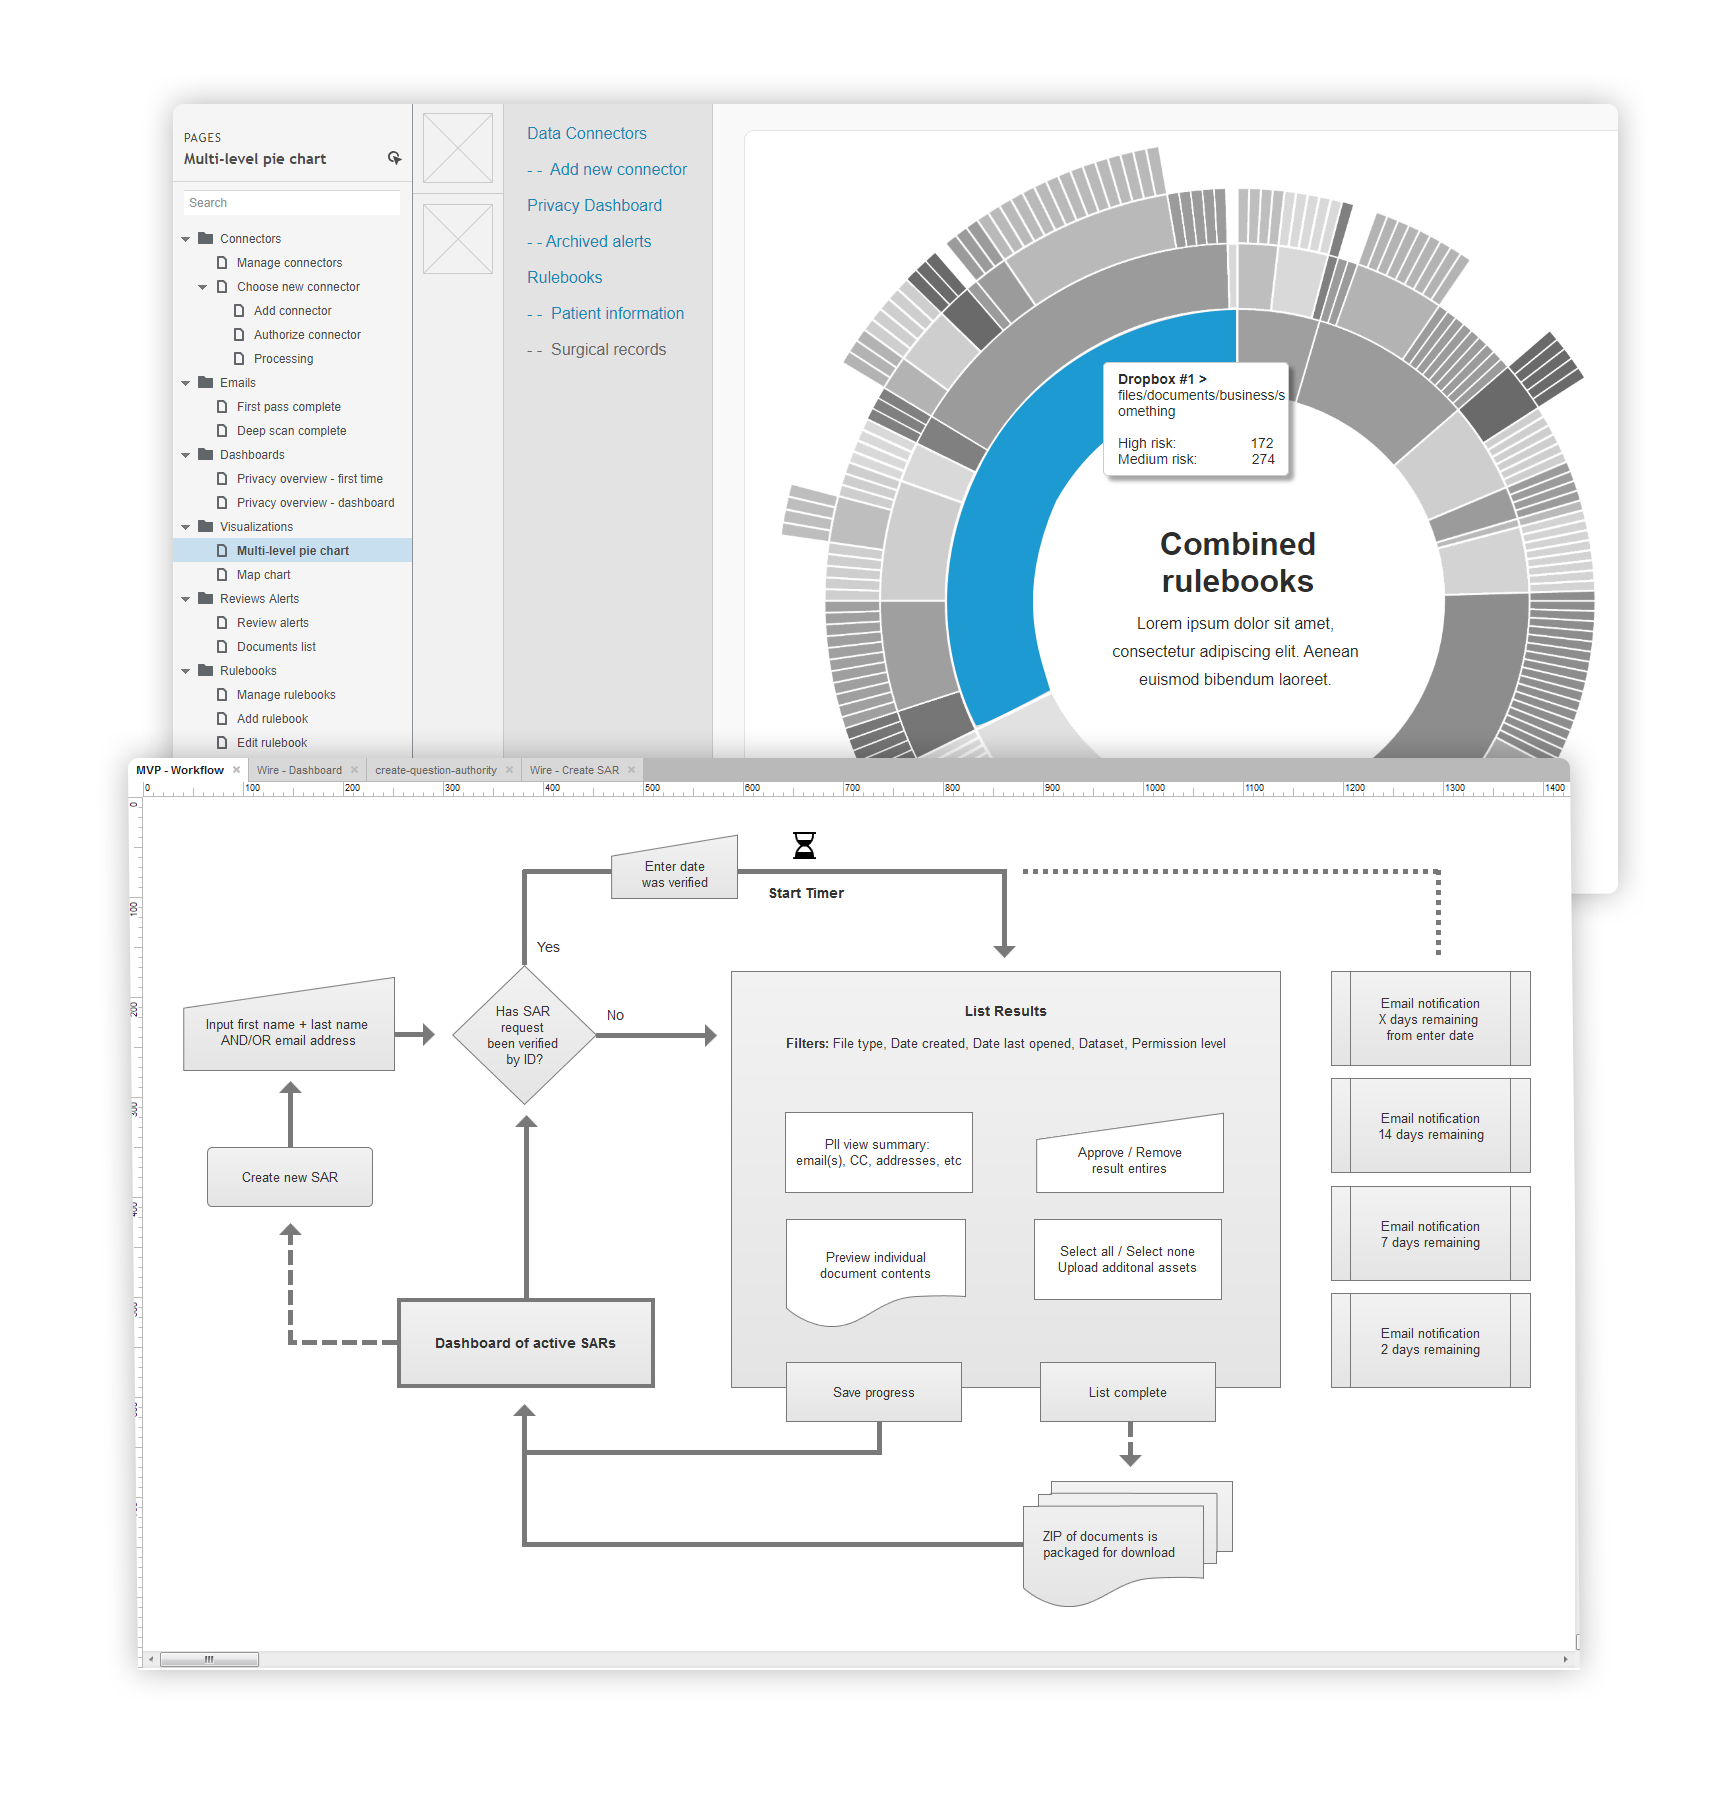
Planning was critical when building such complex data-intensive apps. I led the group through workshops and sticky sessions to correctly map out our approach. This was followed by wireframes and interactive prototype iterations, both designed in Axure. We often looped back to test direction with our team, stakeholders and at times select customers.
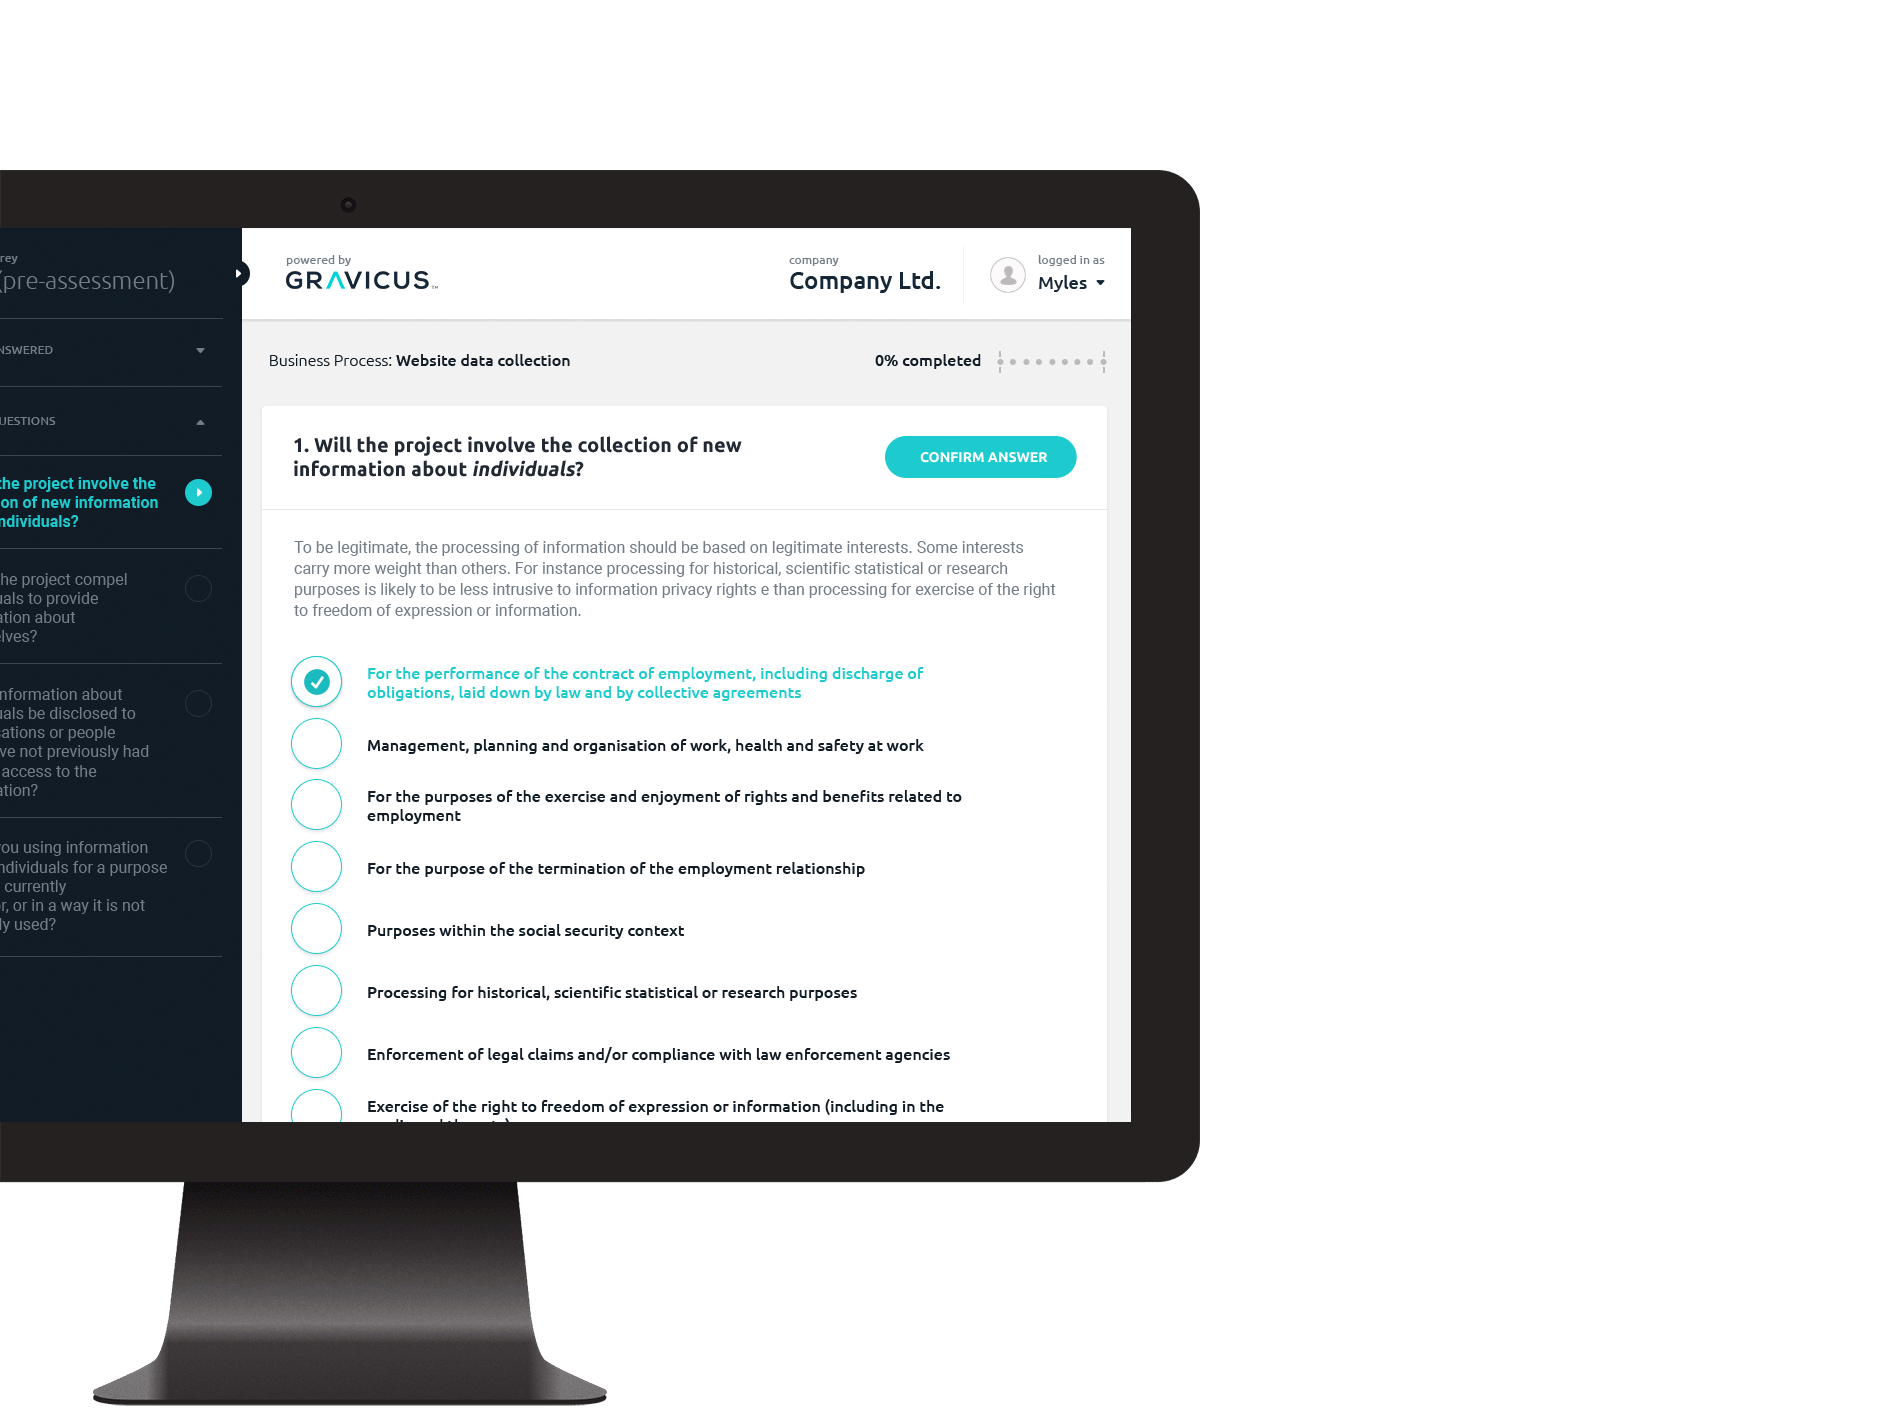
UI Design
User Interface
The planning that went into the initial stages of each app helped build out the assets in the style guide we would be using throughout the apps.
I branded (and in some cases re-branded work prior to my joining) multiple apps within the platform, as well as assisted the front-end team in polishing up some of the React app work, such as legacy CSS, along the journey to deployment over the course of many releases.
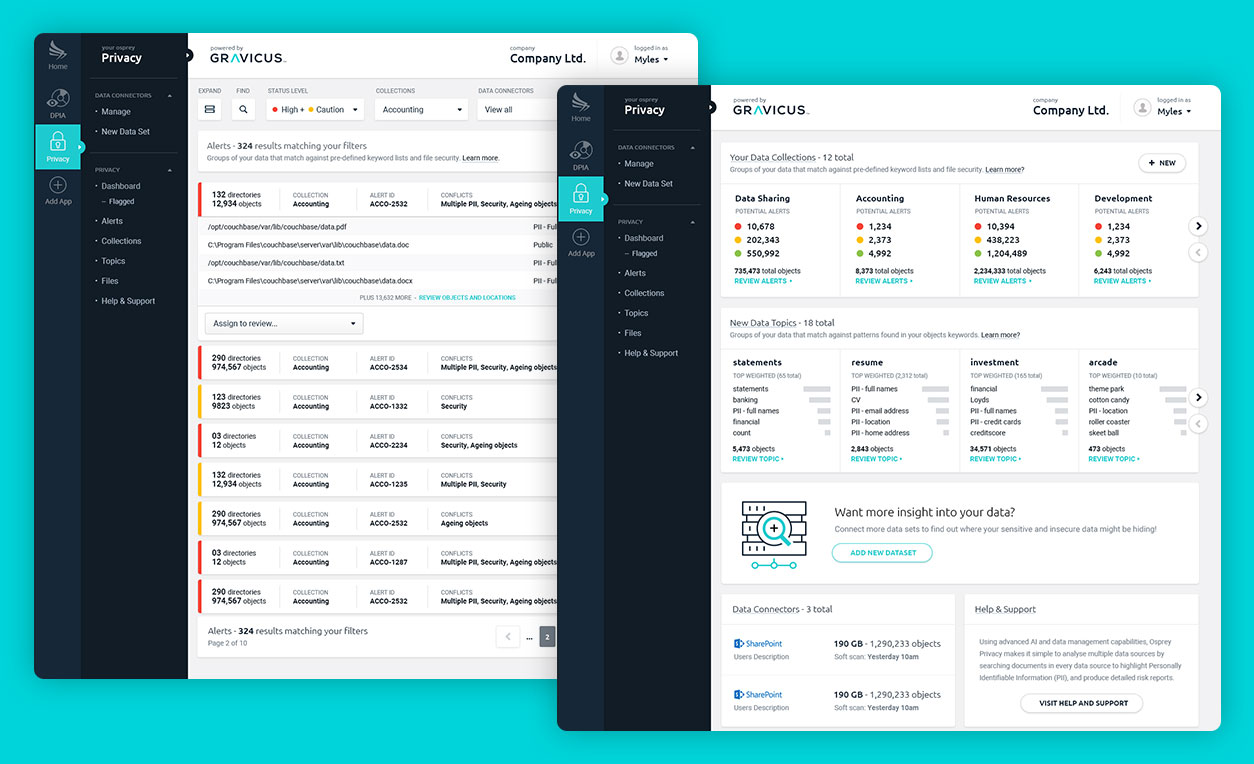
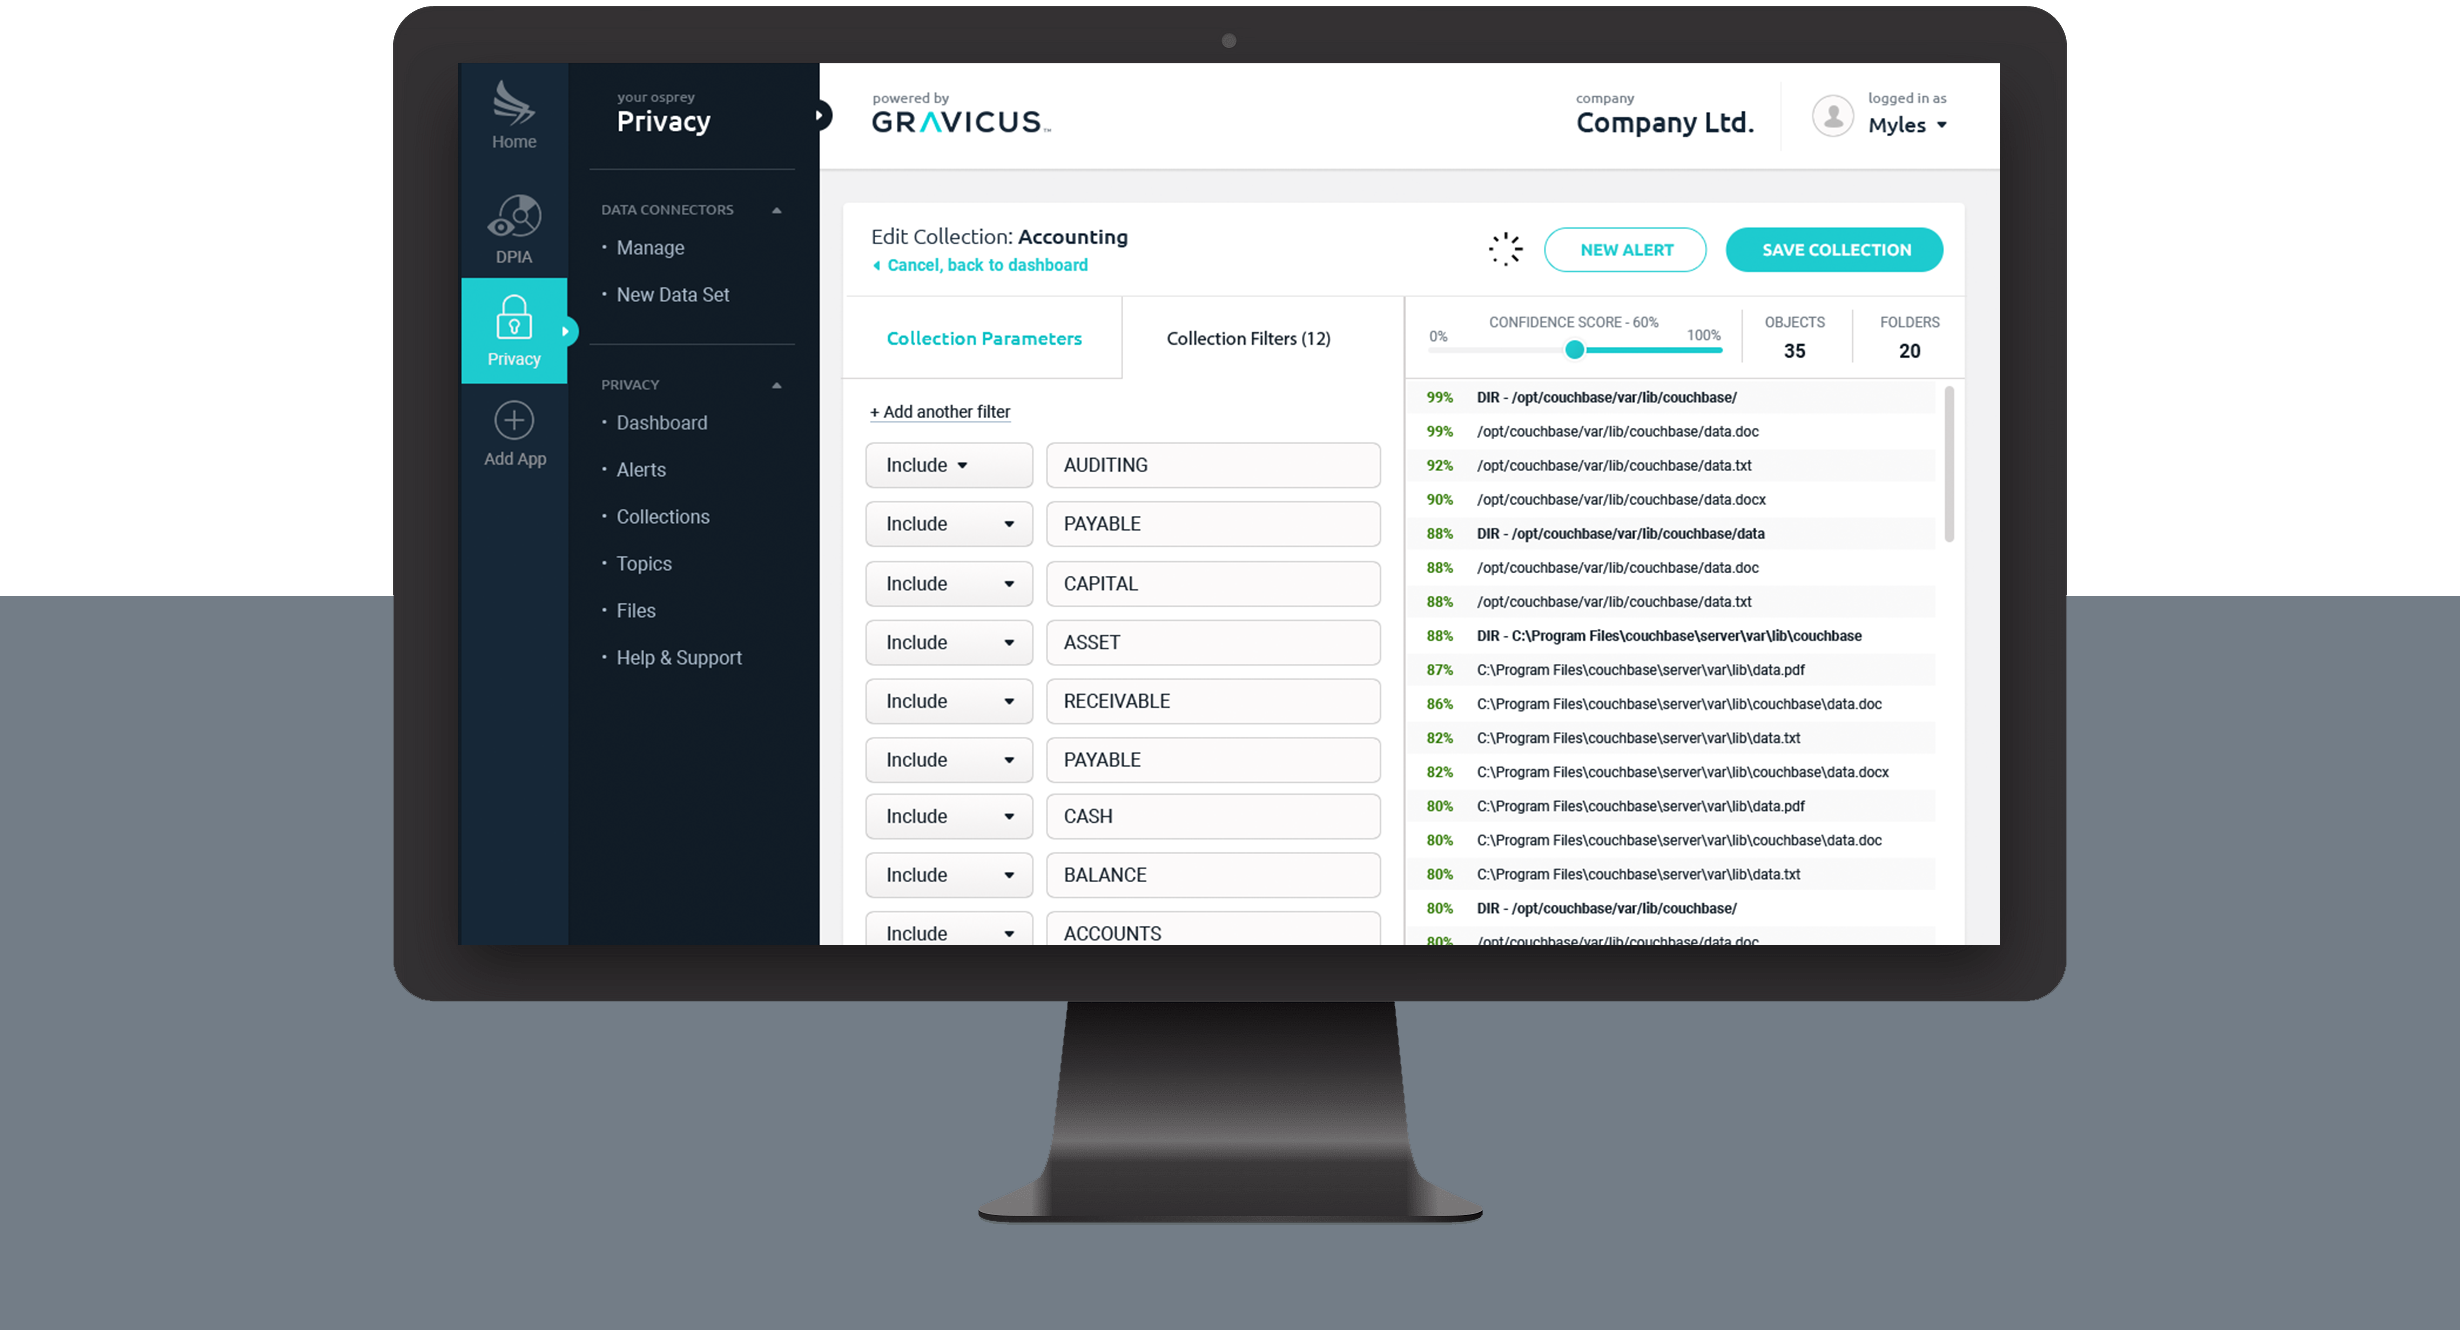
Collections
Once multiple data sets have been connected to the platform, users can then begin to customize collections based on a range of parameters to begin real-time analysis of their data.
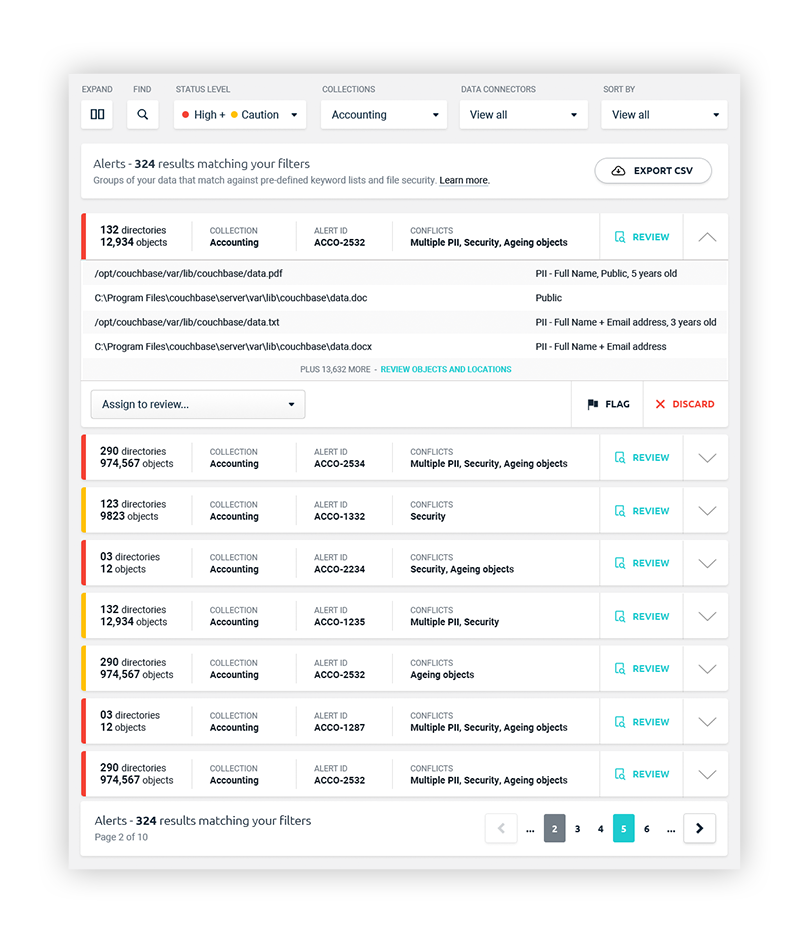
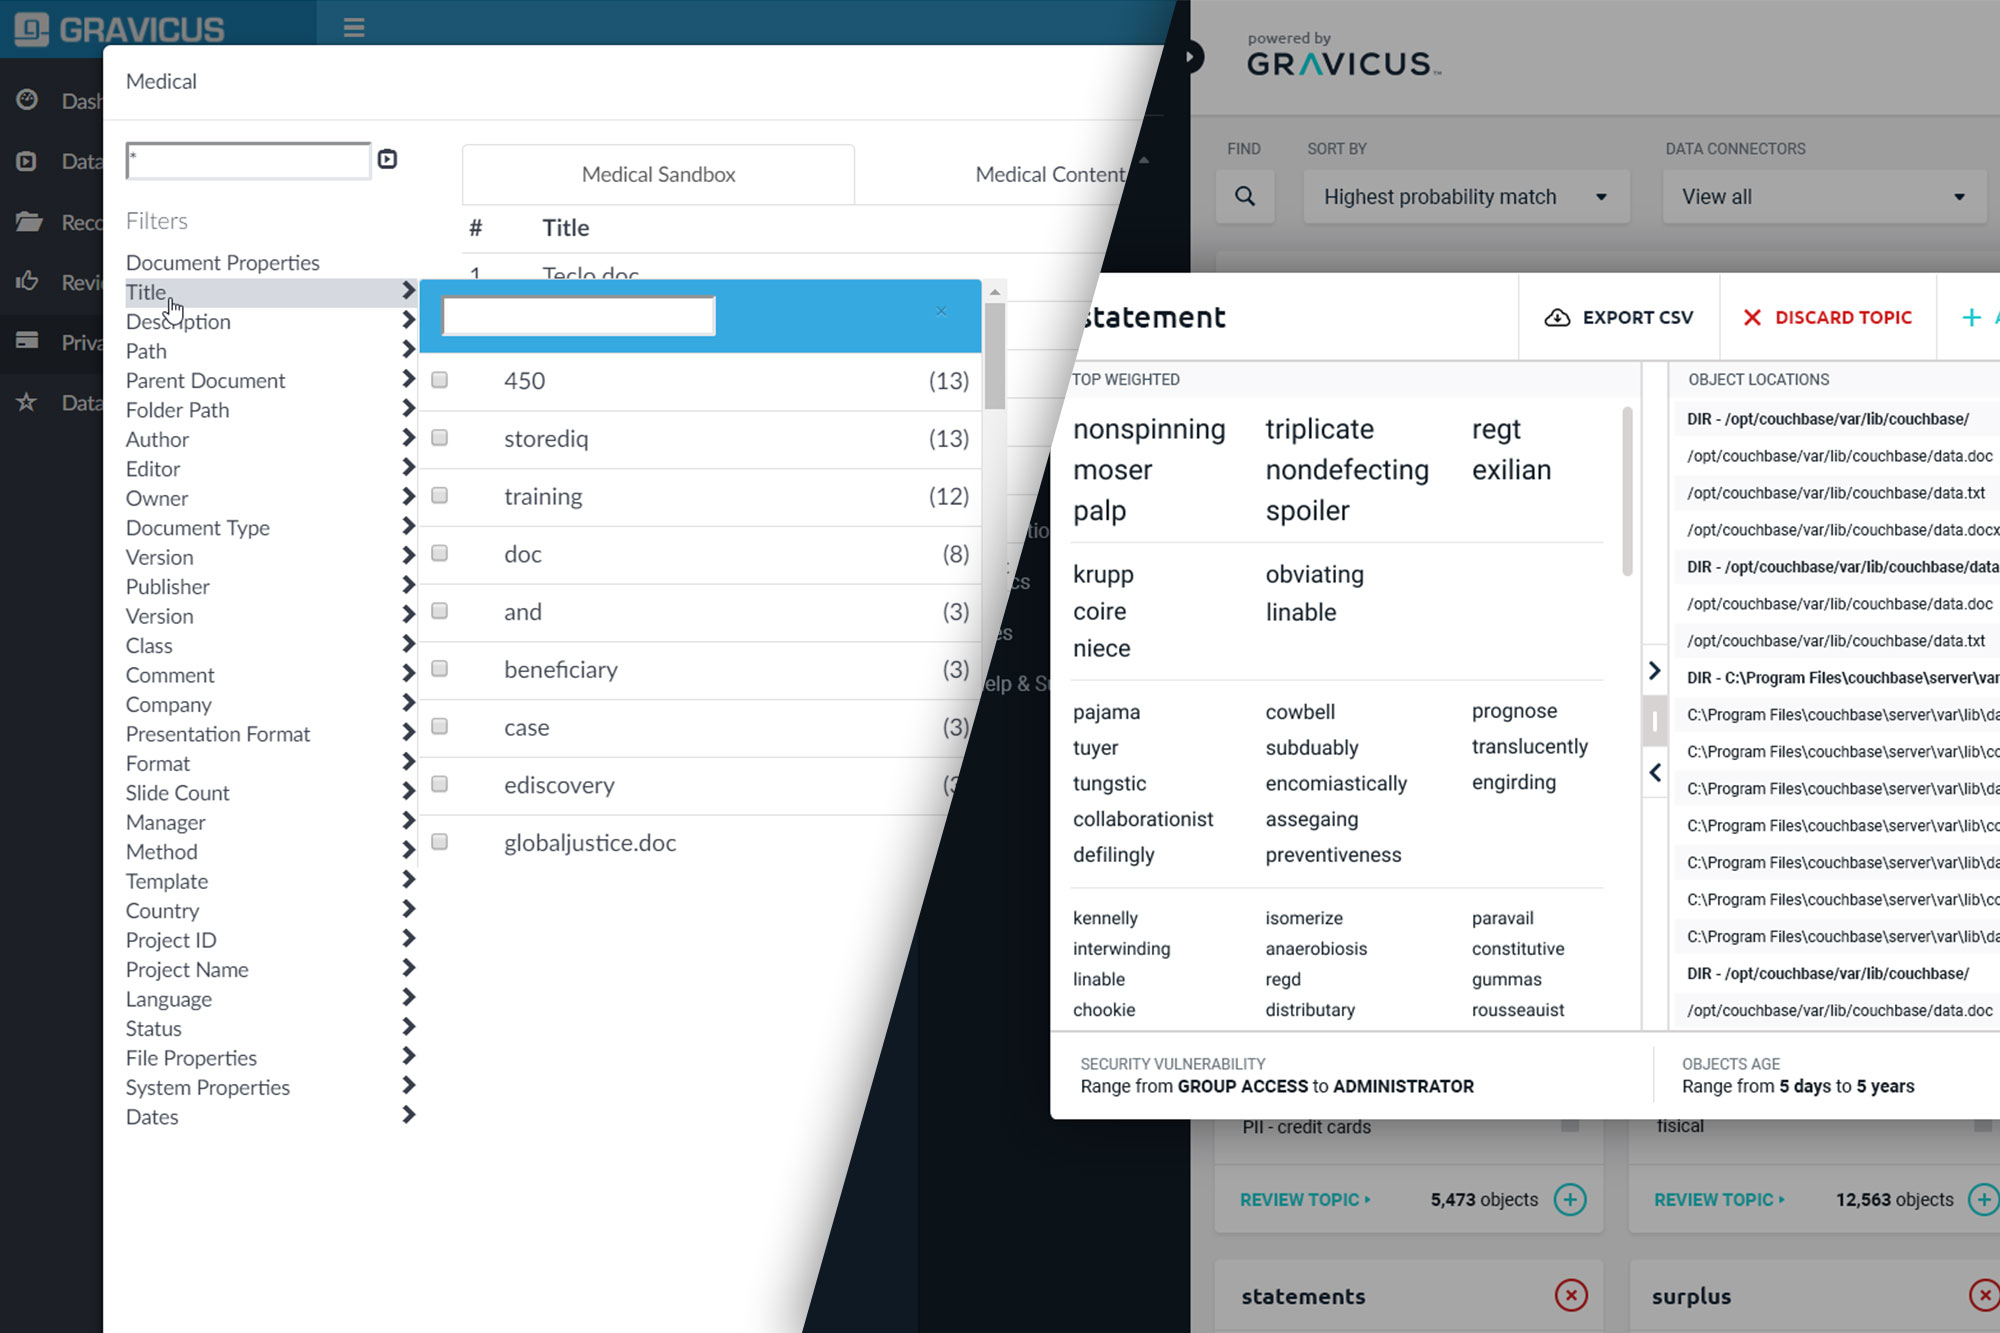
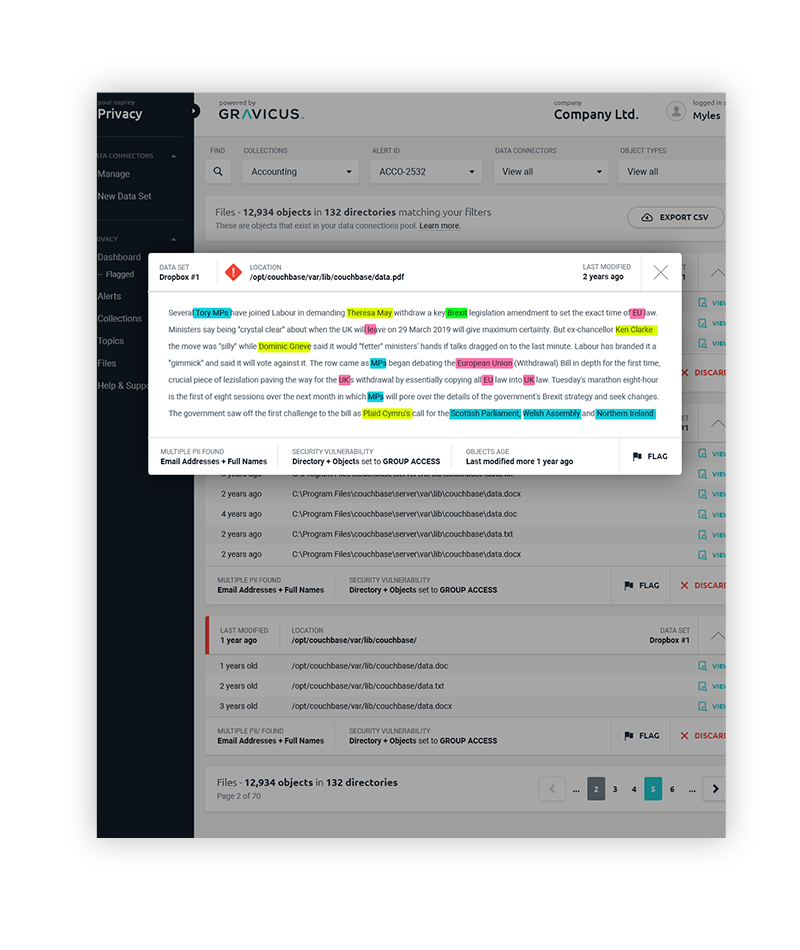
Data Alerts and Natural Language Processing
Once collections are active, the system acts similar to an anti-virus scanner to alert on potential data risk.
Visualization
We chose to go with React-Vis over D3.js for our front-end visual library. These are just a few of my favourite screens.
Outcome
Problem & Solution
The most challenging aspect of this project was correctly visualizing matching and relationships between complex data sets, while maintaining UX usability that would allow the average user to interact with and easily digest their multiple datasets in a single aggregated view.
Research around various JavaScript visualization libraries, their capabilities and integration pain points proved paramount to the success of this project. Success was based on the strategy and teamwork that went into the initial stages of planning while working concurrently alongside the front-end and back-end teams. This ensured successful deployments throughout the project lifecycle.